Curtain Twitcher
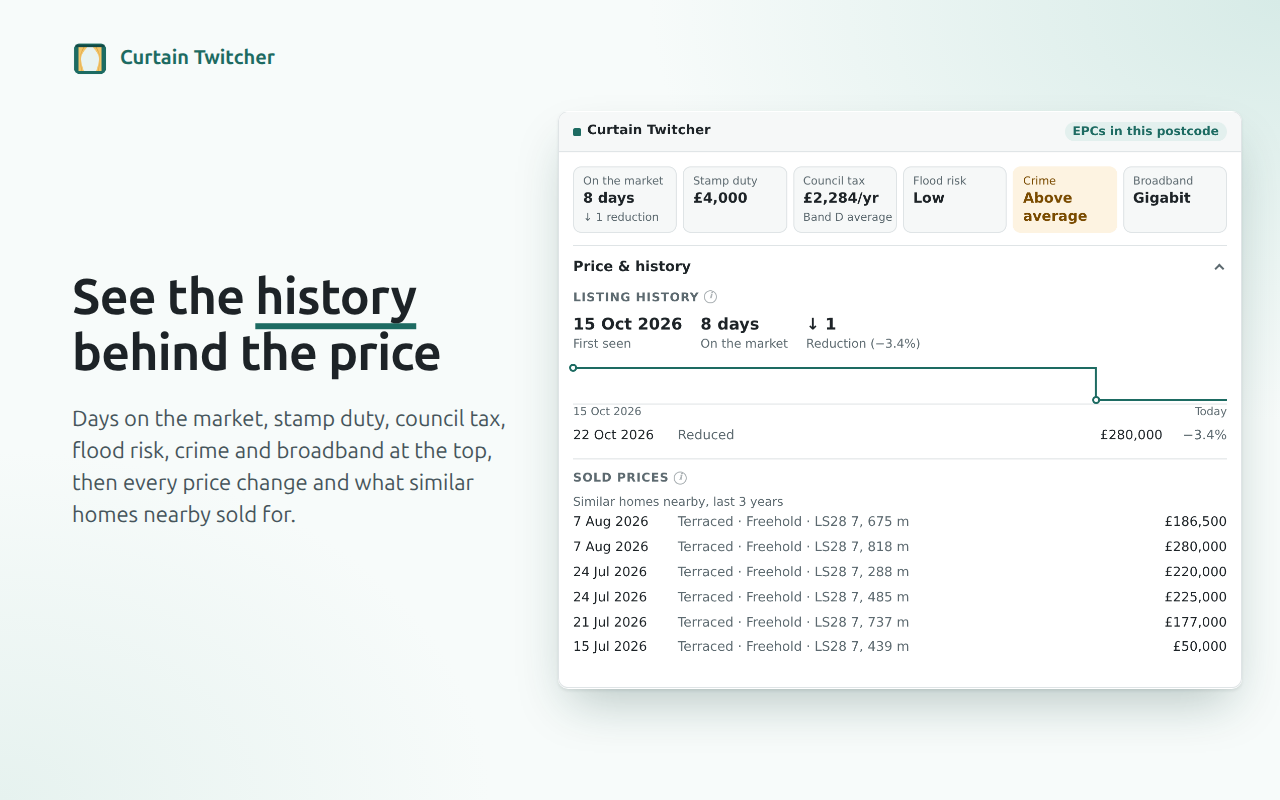
House price history for Rightmove, Zoopla (from version 0.7) and OnTheMarket. Open a listing and see when it first appeared, every price reduction, what the home and its neighbours actually sold for, its energy rating and its price per square foot.
Listing history
First seen, days on the market and every reduction with its date, on the listing and as a badge on each search result, plus the same home on other portals and its relists. From version 0.6, the home's earlier sales and listings on one timeline, so you can see how the asking price compares with what it last sold for.
Sold prices and EPC
What this home and similar homes nearby sold for, from HM Land Registry, plus its EPC rating and floor area. Homes below C are flagged for the 2030 rental minimum.
Costs
Stamp duty at the asking price, council tax for the band, typical local rent and the gross yield, and a rough energy bill from the home's EPC.
The area
A rough value range from the last sale and local price changes, crime and deprivation, broadband, air quality, who lives there from the 2021 census, road and rail noise, and flood risk from every source.
Nearby
The nearest schools with Ofsted and GCSE results, GP surgeries, nurseries, stations with how busy they are, bus stops and green space.
Planning and hazards
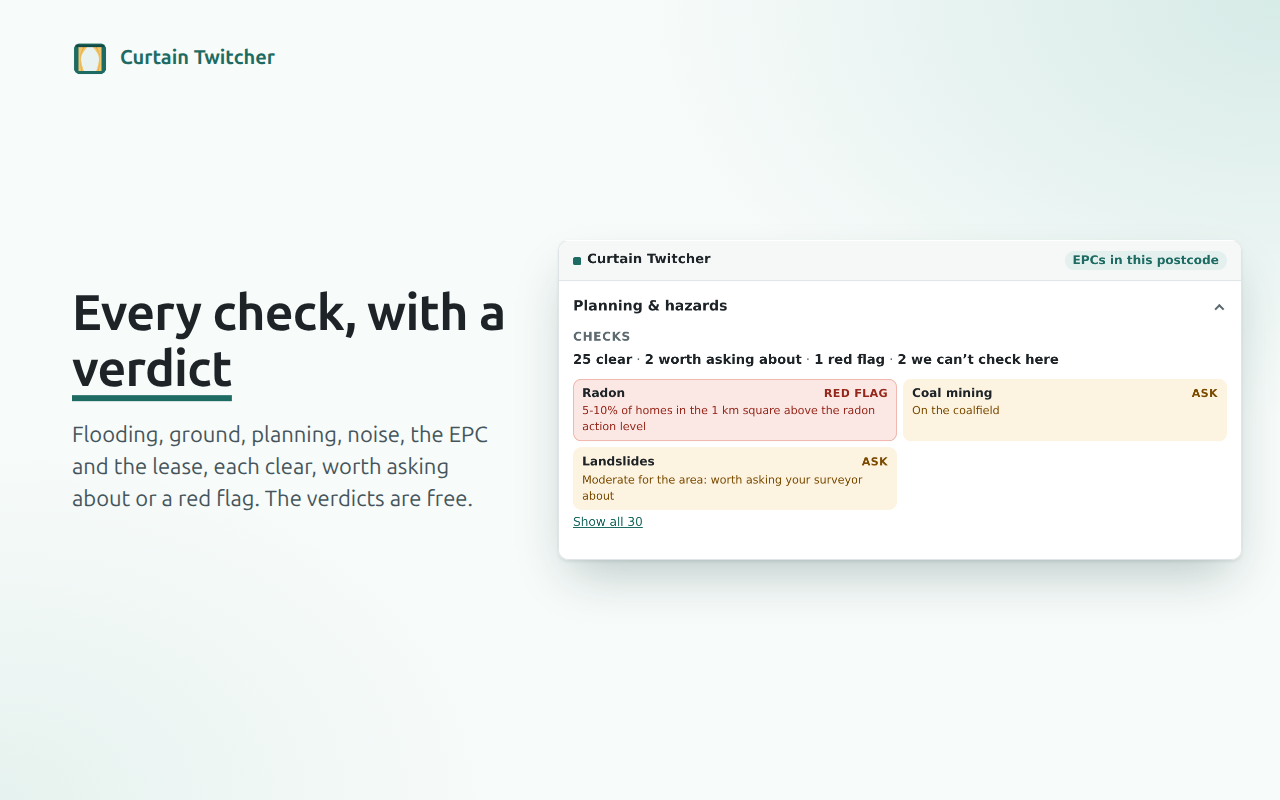
Conservation areas, listed buildings, green belt, national parks and protected sites, plus radon, coal mining and ground stability.
Checks
From version 0.6, one verdict for each thing that can go wrong: flooding, ground, planning, noise, the EPC and the lease. Clear, worth asking about or a red flag, and "can't check here" where there's no data, never a false all-clear. Free for everyone.
Comparable sales
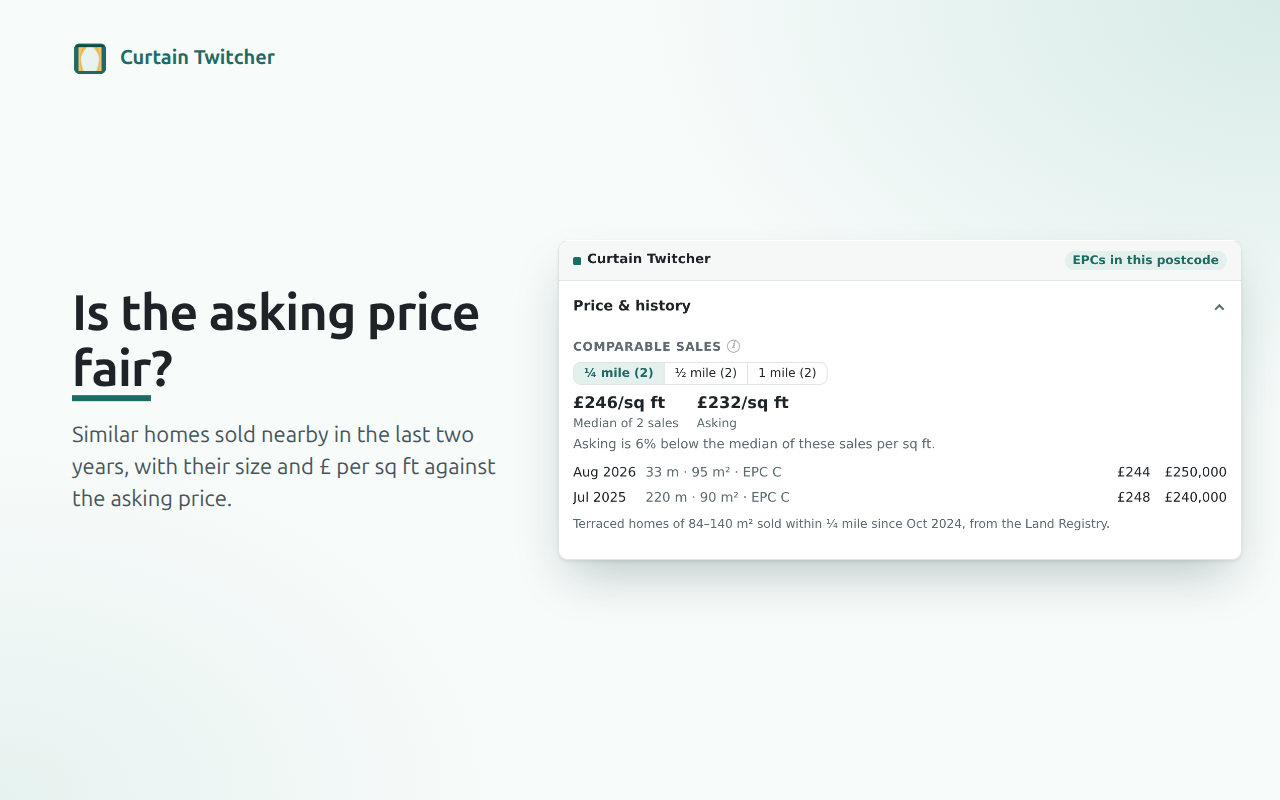
From version 0.6, homes of the same type and size sold within a quarter, half or whole mile in the last two years, with their price per square foot against the asking price.
Price per square foot
The asking price per square foot against what homes in the area sold for, so you can see at a glance whether it's priced high or low.
Getting started
- Install Curtain Twitcher from the Chrome Web Store (it works in Edge too). The Firefox version is with Mozilla for review.
- On the welcome page, choose whether to share community data. It builds the price histories everyone sees, and the extension works either way.
- Open any property for sale on Rightmove, Zoopla or OnTheMarket. The Curtain Twitcher panel appears next to the price.
How sure is the match?
Listings don't show a house number, so we match each one to its energy certificate and sale records using the postcode, the map pin, the property type and the size. The panel always says how sure it is:
- Matched to this home or Likely this home: we're confident it's this property.
- EPCs in this postcode: we couldn't pick out the home, so you see the ratings for the whole postcode instead, never someone else's home presented as this one.
Pricing
- Free: everything about the listing (history, reductions, sold prices, EPC, price per square foot), the summary of costs and the area, the search-result badges and sorting, and every safety warning: flood risk, radon, coal mining, significant ground hazards, conservation areas and listed buildings.
- Buying pass, £9.99 for 3 months or £14.99 for 6 months: the full detail (rough value range, comparable sales, energy bills and the EPC's recommended improvements, rent and yield, the area report, noise, nearby places, and the detail behind each check), a watchlist with email alerts when a price or status changes, notes, CSV export, "Match my brief", which ranks the results you're looking at against what you want, and from version 0.5 a summary of any home to print or save as a PDF, with questions to ask the agent, and a side-by-side comparison of your watched homes.
- One payment, no subscription. Nothing renews and there's nothing to cancel; buying another pass adds its time on top of what's left.
Troubleshooting
- No panel on a listing: reload the page. The portals change their pages from time to time; if the panel still doesn't appear, email us and we'll fix it.
- No price history yet: history is built from community data, so a listing nobody has viewed with the extension starts from the day you first see it. If the portal says it was reduced before that, you'll see the date of the cut. From version 0.7, where the estate agent's own website showed the earlier price, you'll see that too; otherwise the earlier price is unknown, as the portals don't show it.
- No sold prices: Land Registry data covers England and Wales only.
CurtainTwitcherBot
If you're an estate agent and you've seen CurtainTwitcherBot in your logs: it's ours. Twice a day it reads the property pages on a small number of agents' own websites to note each listing's asking price, status and the date we saw it, so buyers can see when a price has changed. It never reads property portals.
- It obeys your robots.txt, including any Crawl-delay, and asks for at most one page every 5 seconds.
- It only keeps the price, status, date and your listing's ID and address as shown. Never photos, descriptions, floorplans or contact details.
- It stops at bot challenges and logins, and never tries to get round them.
- To opt out, block
CurtainTwitcherBotin robots.txt or email admin@onibaku.co.uk, and we'll stop within 24 hours.
Data sources
Everything in the panel comes from UK open data, licensed under the Open Government Licence v3.0 unless noted.
- Contains HM Land Registry data © Crown copyright and database right 2021. UK House Price Index: HM Land Registry.
- Energy performance data: the EPC registers for England and Wales, and the Scottish Government.
- Contains OS data © Crown copyright and database right 2026.
- Station locations: NaPTAN, Department for Transport. Station usage: Office of Rail and Road.
- Flood risk: © Environment Agency copyright and/or database right 2025. All rights reserved.
- Schools and school results: Department for Education (Get Information about Schools) and Ofsted. Early years: Ofsted.
- Planning constraints: planning.data.gov.uk.
- Council tax: MHCLG, Welsh Government, Scottish Government and Valuation Office Agency.
- Private rents and Census 2021: Office for National Statistics. Contains National Statistics data © Crown copyright and database right 2026.
- Deprivation: English Indices of Deprivation 2025 (MHCLG), Welsh Index of Multiple Deprivation 2025 (Welsh Government), Scottish Index of Multiple Deprivation 2020 (Scottish Government).
- Crime: data.police.uk.
- Broadband coverage: Ofcom Connected Nations.
- Air quality: Defra, uk-air.defra.gov.uk.
- Contains British Geological Survey materials © UKRI 2026. Radon: British Geological Survey and UK Health Security Agency.
- Mining: Mining Remediation Authority (formerly the Coal Authority).
- GP practices: contains public sector information from NHS England (Organisation Data Service) and Public Health Scotland.
- Road and rail noise (England): © Department for Environment, Food & Rural Affairs copyright and/or database right 2023.
- Road and rail noise (Scotland): © Scottish Government, contains Ordnance Survey data © Crown copyright and database right 2024.
Curtain Twitcher isn't affiliated with or endorsed by Rightmove, Zoopla or OnTheMarket.